Fifteen. That’s how many of the 396 vulnerabilities CISA added to its Known Exploited Vulnerabilities catalog within a week of their public disclosure were sitting in EPSS’s top-risk decile the day before CISA confirmed them. Fifteen out of 396, or 3.8%.
We’ve been tracking the KEV catalog since it opened in November 2021, and we already store the one number nobody else does: how long each vulnerability was public before CISA confirmed exploitation. So we went back and asked EPSS what it thought about every one of those 1,673 entries on the day before it landed — no hindsight, no peeking at data that arrived after CISA acted. Here’s what came back.
What We Measured
EPSS is FIRST’s Exploit Prediction Scoring System. It publishes a daily probability, per CVE, that someone will exploit it in the next 30 days, plus a percentile ranking that vulnerability against every other scored CVE. Teams use it to decide what to patch first when the list is longer than the week.
The KEV catalog is the other half: CISA’s list of vulnerabilities with confirmed, real-world exploitation. If EPSS is any good at what it claims, the things that end up in KEV should have been ranked high beforehand.
For each of the 1,673 KEV entries, we pulled EPSS’s published score for the day before CISA added it. Where EPSS had no data for that exact date, we stepped backward to the nearest earlier date it did publish. We never step forward — a score published after CISA acted has already seen the news, and grading a forecast on information it didn’t have is how you get a flattering number that means nothing.
| Dataset | Value |
|---|---|
| KEV entries analyzed | 1,673 |
| Date range of KEV additions | Nov 3, 2021 – Aug 20, 2026 |
| Entries with a day-before EPSS score | 1,382 (82.6%) |
| Entries with no EPSS score the day before | 291 (17.4%) |
| Median day-before percentile | 83.9th |
| Median day-before probability | 4.2% |
That 17.4% deserves a flag before we go further. Those aren’t low scores — they’re the absence of a score. EPSS hadn’t published anything for those CVEs yet, usually because they were too new. We report them separately everywhere below rather than quietly dropping them, because dropping them is exactly the move that would make EPSS look better than it is.
The Aggregate Number
Of the 1,382 entries EPSS had scored, 599 (43.3%) were in the top decile the day before CISA confirmed exploitation. The other 783 (56.7%) weren’t. Grade it on raw probability instead of percentile and it gets harsher: only 317, or 22.9%, carried a better-than-even chance of exploitation.
| Day-before percentile | Entries | Share of scored |
|---|---|---|
| 99th and above | 275 | 19.9% |
| 90th – 99th | 324 | 23.4% |
| 50th – 90th | 374 | 27.1% |
| 10th – 50th | 331 | 24.0% |
| Below 10th | 78 | 5.6% |
Take the top two rows together and you get a defensible one-liner: more than half of the vulnerabilities that turned out to be exploited weren’t in the top 10% of risk the day before anyone confirmed it. That’s the number we expected to publish. Then we split the data by age and found something more useful.
The Part That Actually Matters
We grouped every entry by its lag — the days between the CVE going public and CISA confirming exploitation. Short lag means a fast-moving vulnerability, the kind that ruins a weekend. Long lag means an old bug that finally got swept into the catalog.
| Days public before KEV | Entries | No score yet | In top decile | Hit rate (of scored) |
|---|---|---|---|---|
| 7 days or fewer | 396 | 262 (66%) | 15 | 11.2% |
| 8 – 30 days | 121 | 4 | 22 | 18.8% |
| 31 – 90 days | 126 | 0 | 37 | 29.4% |
| 91 – 365 days | 254 | 1 | 84 | 33.2% |
| More than 365 days | 776 | 24 | 441 | 58.6% |
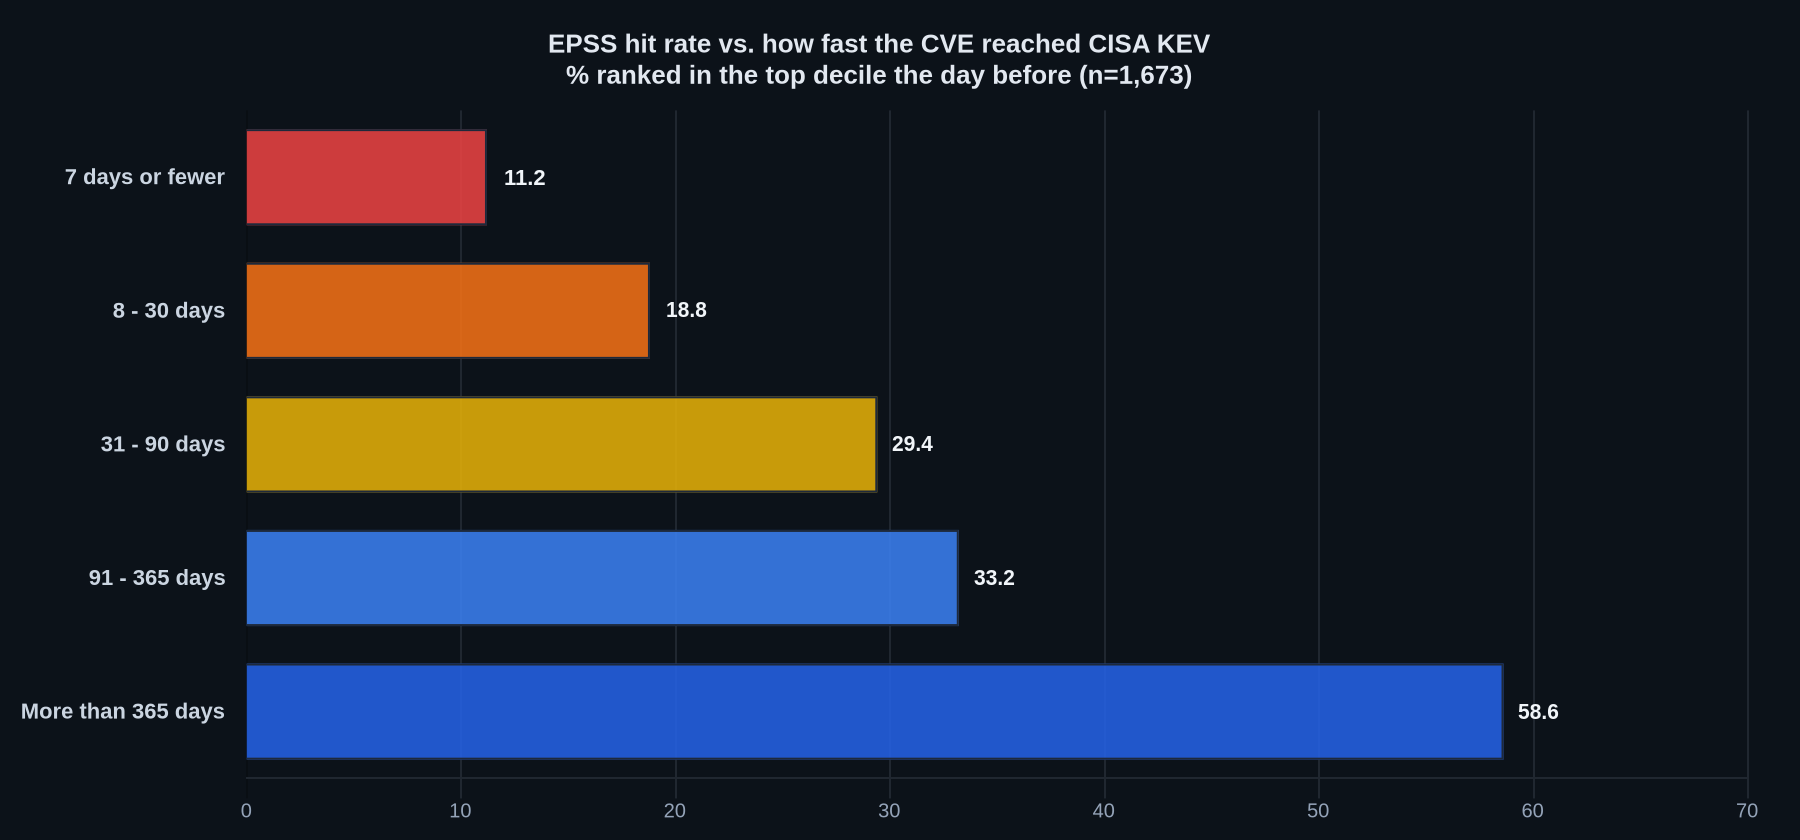
The hit rate climbs from 11.2% to 58.6% as the vulnerability gets older. And in the fastest group, two thirds had no score at all — so counting everything in that row, 15 of 396 got flagged. The aggregate 43.3% is carried almost entirely by the bottom row: 776 entries, median age 1,436 days. Nearly four years.
EPSS scores those well because by then there’s plenty to score on — public exploit code, scanner signatures, years of chatter. That’s not a prediction in any sense a defender cares about. It’s a description of something everyone already knows.
The named examples make the same point faster than the table does. Here’s what EPSS ranked lowest among recent, high-severity entries:
| CVE | Product | CVSS | Day-before percentile | Days public |
|---|---|---|---|---|
| CVE-2026-9082 | Drupal Core | 9.8 | 1.7th | 2 |
| CVE-2025-8088 | RARLAB WinRAR | 8.8 | 3.0th | 4 |
| CVE-2026-3055 | Citrix NetScaler | 9.8 | 7.1st | 7 |
| CVE-2025-30066 | tj-actions/changed-files | 8.6 | 6.1st | 3 |
| CVE-2026-35616 | Fortinet FortiClient EMS | 9.8 | 10.1st | 2 |
| CVE-2026-2441 | Google Chromium | 8.8 | 8.1st | 4 |
And here’s where EPSS was most confident, among entries added in the same period:
| CVE | Vendor | Day-before percentile | Days public |
|---|---|---|---|
| CVE-2016-10033 | PHP (PHPMailer) | 99.99th | 3,111 |
| CVE-2017-1000353 | Jenkins | 99.98th | 2,803 |
| CVE-2017-7921 | Hikvision | 99.91st | 3,225 |
| CVE-2021-43798 | Grafana | 99.96th | 1,402 |
Every confident call is four to nine years old. Every miss is days old. That’s the whole finding in two tables.
Does Ransomware Change It?
Barely. CISA flags entries with known ransomware campaign use, and we checked whether EPSS ranked those higher. Among scored entries, 48.6% of the ransomware-linked ones were in the top decile versus 42.0% of the rest — a real gap, but not the separation you’d want from a signal you’re using to decide what to fix tonight. Roughly half the vulnerabilities that ransomware crews were already using didn’t rank in the top 10%.
The CVEDaily Take
We’re not arguing EPSS is broken, and we’d rather have it than not. Our data can’t say anything about how well it filters out the vulnerabilities that never get exploited, and that’s most of them — a model that lets you ignore 90% of your backlog with confidence is worth a lot, even if it misses the fast movers.
What our data does say is narrower and more practical: EPSS is weakest exactly where the pressure is highest. A brand-new critical bug in something you run is the case where you most want a second opinion, and it’s the case where EPSS most often has nothing to say, or says the wrong thing. If your patch process reads “top decile jumps the queue, everything else waits for the cycle,” then Drupal at the 1.7th percentile waits — and it was under attack two days after disclosure.
The fix isn’t complicated. Treat a KEV listing as its own trigger, not as confirmation of what your scores already told you, and don’t let a low EPSS score override a vendor advisory on software you actually run. EPSS earns its place ordering the long tail. It hasn’t earned the right to be the only input on week one.
FAQ
-
Doesn’t this just measure recall and ignore false positives?
Yes, and that’s a real limit. Every entry here ended up in KEV, so we can only report how many EPSS ranked highly beforehand. We can’t measure how many high-scoring CVEs never got exploited, which is the other half of any honest evaluation. If you’re comparing prioritization strategies, this dataset tells you about misses, not about wasted effort. -
Why use the percentile instead of the raw probability?
EPSS has changed models several times, and raw scores from different versions aren’t comparable — a 0.3 in 2022 doesn’t mean what a 0.3 means now. The percentile is relative to whatever the model was doing that day, so it survives the version changes. We report both, and the raw scores are harsher: a median of 4.2%. -
What does “no score the day before” actually mean?
EPSS hadn’t published a row for that CVE yet on that date. It’s usually a timing gap on very fresh CVEs, and it hits hardest in the group that matters most — two thirds of the vulnerabilities added to KEV within a week of disclosure had no score at all. We count those separately rather than treating them as zeros or dropping them.
Methodology and Limits
Source data: CISA’s KEV catalog and FIRST’s daily EPSS publications, both public. The lag figure comes from our own tracking, calculated against the NVD publication date for each CVE. All 1,673 entries in the catalog as of August 20, 2026 are included — no sampling, no exclusions.
For the day-before lookup we query EPSS for the date immediately preceding the KEV addition, and step backward to the nearest earlier publication when that date is missing. We never step forward. 62 entries carry a negative lag, meaning CISA listed them before NVD published the record; those sit in the “7 days or fewer” group.
Percentile thresholds are ours, not FIRST’s — “top decile” means the 90th percentile and above, which is the cutoff most prioritization policies we’ve seen actually use. FIRST doesn’t publish an official threshold, and a different cutoff moves these numbers. The full dataset is below if you’d rather pick your own.
Get the Data
Every number above is reproducible from data we publish. The CSV extract is a direct download with no signup — all 1,673 rows with the day-before score, the day-before percentile, and our lag figure, which is enough to rebuild every table in this article. The full file adds CVSS, the ransomware flag, vendor and product, CISA’s dates and deadlines, and the current EPSS score — 16 columns in CSV or JSON, and it goes out by email. You can also browse the whole thing or check any single entry on our KEV lag tracker. If you find an error in it, tell us and we’ll fix it.